Web Application Help Web Application Help
The Layer List widget provides a list of operational layers and their symbols, and allows you to turn individual layers on and off. Each layer in the list has a check box that allows you to easily control its visibility. Layers having expansion arrows indicate that they contain sublayers or subtypes.
The order in which layers appear in this widget corresponds to the layer order in the map. This widget provides functionality allowing you to change the order of layers in the map.

The Legend widget displays labels and symbols for layers in the map. It supports dynamic, tiled, image, feature, KML layer types, and WMS layers with an associated legend URL. The Legend widget can be set to automatically update when the visibility of a layer or sublayer changes. When no operational layers are rendered in the map, the Legend widget is blank.
Basemaps are not shown in the Legend widget by default. The order in which layers appear in the Legend widget corresponds to the layer order in the map. The widget can also be set to respect the scale dependencies of the layers in the map. This can be a useful indicator to map readers that additional data layers are present in the map but currently not displayed in the map because of scale dependencies.
When the application starts, the Legend widget is automatically enabled. Clicking the Legend widget displays the legend window. Clicking the X button in the upper right corner of the legend window closes it.

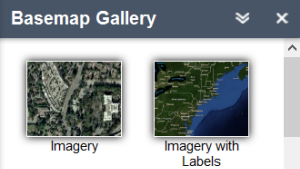
Clicking the Basemap Gallery widget displays all the basemaps configured for this widget. Clicking one of the basemap thumbnails sets it as the active basemap for the application. Click the X button in the upper right corner of the Basemap Gallery window to close it.
Clicking the Bookmark widget displays all pre-defined bookmarks, including bookmarks specified using the widget configuration window, and bookmarks defined in the web map used in the application. Clicking one of the bookmark thumbnails in the list sets the map extent to the bookmark area. You can also add additional bookmarks by zooming to your desired location and clicking the + icon next to the text box. To delete a bookmark defined at run time or configured using the widget configuration window, click the bookmark icon to highlight it first, and click the Delete button to delete it. If the bookmark is inherited from the web map, the Delete button is greyed out.
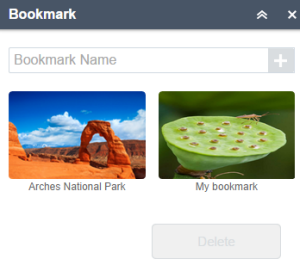
Clicking the X button in the upper right corner of the Bookmark window closes the bookmark window.
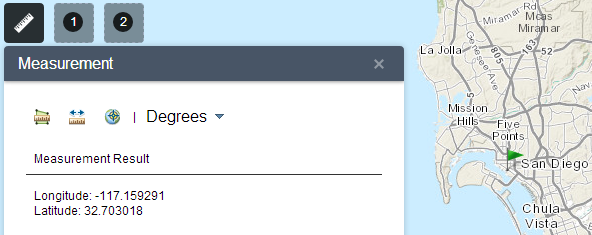
 and click a point on the map. The Measurement widget displays the coordinates for the point in Degrees
(decimal). You may change the coordinate display format to
degrees/minutes/seconds by changing the Degrees drop-down to
DMS.
and click a point on the map. The Measurement widget displays the coordinates for the point in Degrees
(decimal). You may change the coordinate display format to
degrees/minutes/seconds by changing the Degrees drop-down to
DMS.
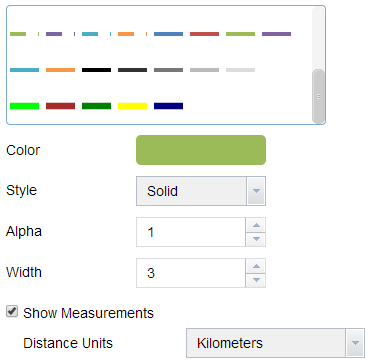
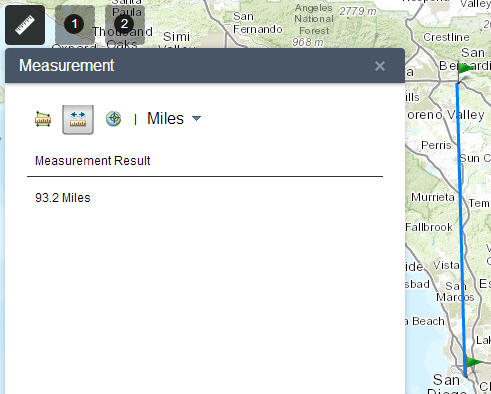
Click the polyline measurement icon and draw a polyline on the map by
clicking two or more points. Double-click to finish drawing the polyline. The
Measurement widget displays the total length of the polyline, using the defined
Default Length Unit. To change the length unit, select the
applicable unit of measure from the Miles drop-down menu.
and draw a polyline on the map by
clicking two or more points. Double-click to finish drawing the polyline. The
Measurement widget displays the total length of the polyline, using the defined
Default Length Unit. To change the length unit, select the
applicable unit of measure from the Miles drop-down menu.
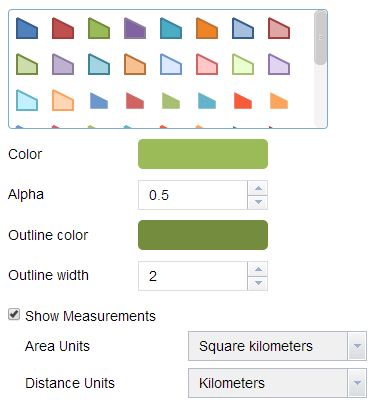
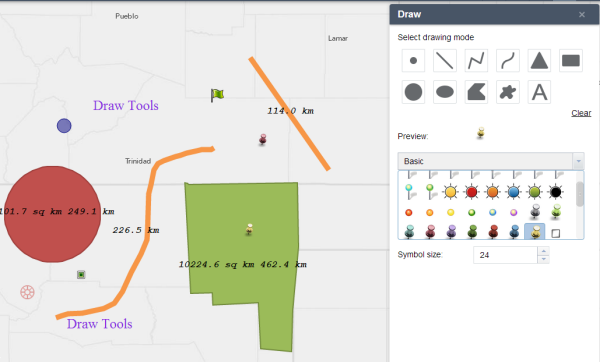
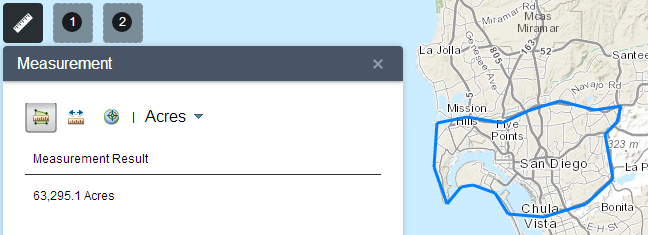
Click the polygon measurement icon and draw a polygon on the map by
clicking three or more points. Double-click to finish drawing the polygon. The
Measurement widget displays the total area of the polygon, using the defined
Default Area Unit. To change the area unit, select the
applicable unit of measure from the Acres drop-down menu.
and draw a polygon on the map by
clicking three or more points. Double-click to finish drawing the polygon. The
Measurement widget displays the total area of the polygon, using the defined
Default Area Unit. To change the area unit, select the
applicable unit of measure from the Acres drop-down menu.
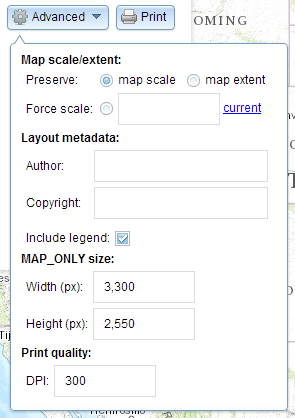 The Map scale/extent
section defines the method that the print service should use to
calculate the printed extent of the map. Preserving map scale
may cause the printed map to maintain its scale while recalculating
the extent around the existing center point, while preserving the map
extent may cause the scale to adjust to fit the current map extent
into the printed map. You may also force a specific scale by checking the
Force scale option and entering a scale. Click
current to populate the value with the present scale of the
map.The Layout metadata allows you to override the
default values set by the configuration. Enter values for the Author
and Copyright fields to provide current information
to the print service. Check the Include legend check box to
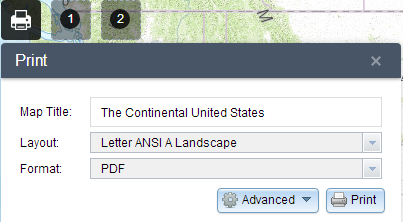
display the legend on the printed map.If the MAP_ONLY format is
selected, you may provide dimensions for the Width and
Height in pixels. Otherwise, these values are ignored.The
Print quality section allows you to update the resolution of
the printed map. Provide an updated value for the DPI (dots
per inch) in the text box.
The Map scale/extent
section defines the method that the print service should use to
calculate the printed extent of the map. Preserving map scale
may cause the printed map to maintain its scale while recalculating
the extent around the existing center point, while preserving the map
extent may cause the scale to adjust to fit the current map extent
into the printed map. You may also force a specific scale by checking the
Force scale option and entering a scale. Click
current to populate the value with the present scale of the
map.The Layout metadata allows you to override the
default values set by the configuration. Enter values for the Author
and Copyright fields to provide current information
to the print service. Check the Include legend check box to
display the legend on the printed map.If the MAP_ONLY format is
selected, you may provide dimensions for the Width and
Height in pixels. Otherwise, these values are ignored.The
Print quality section allows you to update the resolution of
the printed map. Provide an updated value for the DPI (dots
per inch) in the text box.
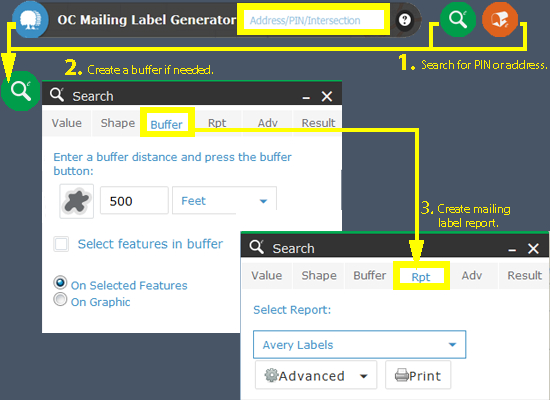
The Search widget allows you to retrieve information from source data by executing a predefined query(s).The Search widget serves as a query builder during configuration, allowing you to define the query by specifying the map service layer url, filter expression, and displaying fields in query results. Each Search works with a single layer. However, you can define multiple searches for a single application, and data layers can be from multiple sources.
Clicking the Search widget in your application displays the widget. Depending on the Initial View choice that was made during configuration the By Value or the By Shape view will be visible.


The Locate serves as a means to locate locations on the map using addresses, pin or coordinates.
Clicking the Locate widget in your application displays the widget. Address, Coordinates and Results tabs will be visible.


The Results view lists all the located features and thier attributes (dependant on the locate type).


The Attribute Table widget displays a tabular view of operational layers' attributes. It displays at the bottom of your web application and can be opened, resized, or closed. When more than one layer's attributes display, multiple tabs automatically generate in the attribute panel allowing you to switch among the attribute tables. You can use the widget's configuration window to specify which layer or layers are included in the tabular view, which fields show, and if the tabular view can be exported.
Currently, layers from map services, feature services, and feature collections in the map are supported. The layers from map services and feature services require query capability to display in the table.


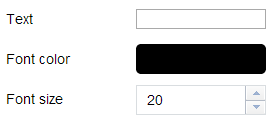
To create labels follow the work flow in the graphic below: